SaaS churn benchmarks (2026)
| Segment | Healthy monthly logo churn |
|---|
| Enterprise | under 0.5% |
| Mid-market | 0.5-1.5% |
| SMB / prosumer | 2-4% |
Anchor on 3.5% monthly. That is the median B2B SaaS logo churn, and it is the one number to hold your own against. The other published figures bracket it rather than argue with it: Recurly’s July 2026 data puts SaaS total monthly churn a little lower at 3.22%, and the $500-$5,000 ACV band runs higher at about 4.1% monthly, which annualizes to roughly 39%. If you sell in that ACV band, read 4.1% as your version of the same anchor.
The split changes what you do about it. Of the 3.5% median, roughly 2.6% is voluntary and 0.8% involuntary. Recurly’s 3.22% splits the same way, 2.16% voluntary and 1.06% involuntary, so the ratio holds even where the totals differ. Failed payments alone are 20-40% of all churn.
Those are two different problems. Voluntary churn is a product and value problem you fix with behavioral intervention. Involuntary churn is a billing problem you fix with dunning and card updaters. Averaging them into one number is why most retention programs work on the wrong half.
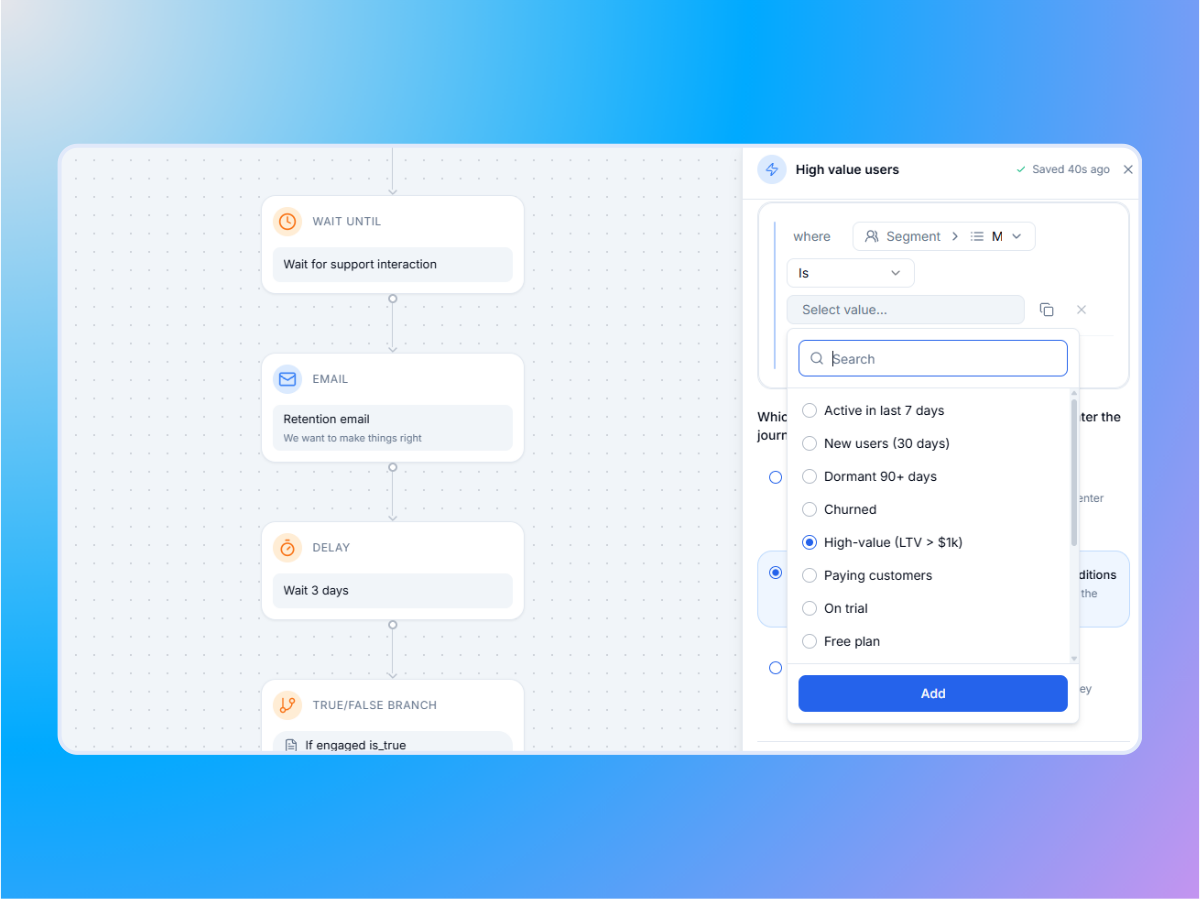
Either half, the save still has to be a send the customer agreed to. Consent sits on the same profile as the churn score, recorded per channel, so a win-back push never goes to someone who only opted into email. Revoke it and the marketing sends stop in real time, with transactional mail untouched.
Sources: Recurly churn benchmarks (July 2026) · Artisan Growth Strategies 2026 (500+ companies) · CRV SaaS churn benchmarks for investors 2026.