


Intempt
Insights

Charts that tell you what changed.

Email sends, product events, and revenue on one profile, so signup to activation to paid stops being a guess. The Data Analyst agent flags the drop, names the driver, and queues the next play. No SQL, no analyst ticket.

Start for free
G2
0.0on G2
10B+events
500M+users
7+years profitable
50+enterprises

Build any view of any metric..

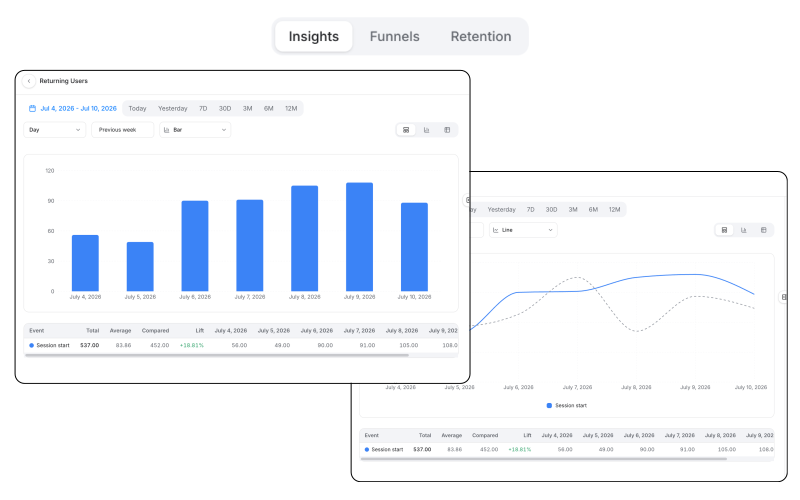
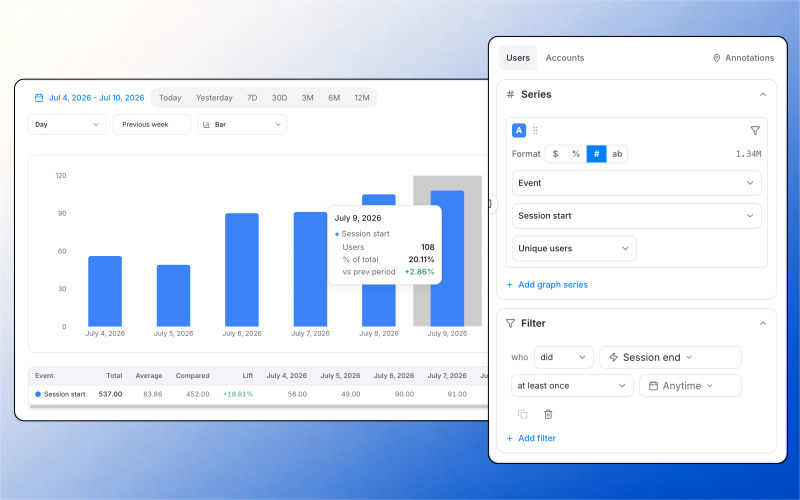
Select any metric, pick your time range, apply a segment filter, and your chart renders in real time. No SQL, no analyst ticket, no waiting.

  • Any tracked metric available for trendingMRR, activation rate, feature adoption.
  • Range and comparison per chartEach chart carries its own time range and its own comparison period.
  • Filter on any dimensionIncluding computed segments, which keep updating while you look at them.
Your key SaaS metrics, ready before your first sprint

Slice every metric by what matters..

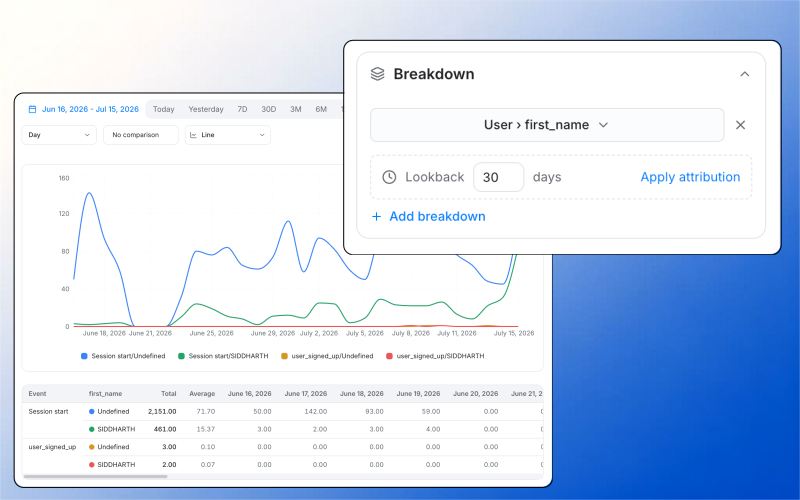
A number without a breakdown is a guess. Split any metric by segment, channel, device, geography, or plan tier and see exactly which slice changed most.

  • Several segments, one chartCompare them in place rather than building a view per segment.
  • Breakdowns name the sliceA move in the line resolves to the segment that caused it.
  • Stacked filtersLayer dimensions to reach the exact cut rather than approximating it.
Build the exact breakdown your team needs

Know what changed and what caused it..

When a metric moves, the Data Analyst agent surfaces the driver in plain language and queues the next play for your approval. Stop debugging data and start acting on what it shows.

  • Anomalies explained in EnglishEvery metric is watched, and a flagged move arrives with its cause written out.
  • Drivers rankedWhich segment, channel or event contributed most, in order.
  • Next action held as a draftAn anomaly queues the response, and it waits for approval before running.
Blu diagnoses your biggest growth gap for you

From raw events to metric insight, fast.

01

Connect your data

Connect your product, billing, and marketing sources. Intempt starts tracking events and building metric history immediately. No custom schema required before your first chart is useful.

02

Pick your metric, time range, and segment

Select any metric from the dropdown, choose your time range, and add a segment filter. Your Insights view renders in real time with no SQL and no analyst ticket.

03

See what moved and why

Intempt detects anomalies and meaningful trends, surfaces the driver in plain language, and queues the next action. You see the insight before you finish reviewing the chart.

Wired into the toolsyour team already opens.

Slack, Stripe, Twilio, SendGrid, Gmail, Google Calendar, Firebase, Apache Kafka, AWS. Blu Agent operates them for you without a browser tab.

JavaScript
Node JS
Apple
Stripe
Gmail
Google Calendar
Google Meet
Twilio
SendGrid
Slack
Amazon SES
Webhook
Apache Kafka
Amazon S3
Firebase Cloud Messaging

In the words of50+ live tenants.

Jim Stromberg, CEO at StockInvest

We were losing visitors before they signed up. Intempt's personalized experiences changed that - we started meeting people where they were instead of guessing. Once they're in, Intempt's automated email takes over and keeps the relationship moving. Acquisition and retention finally feel like one connected motion instead of two separate problems.

Jim Stromberg

CEO, StockInvest

Eric Gardner, COO at FieldsUSA

Intempt helped us turn real browsing and purchase signals into personalized experiences that drive repeat buying. We finally have one system that sees the whole customer journey.

Eric Gardner

COO, FieldsUSA

Tadas Kertenis, Co-founder at Hoperfy

With Intempt, we built a signal-led pipeline driven by real behaviors. Follow-ups are triggered by intent signals instead of timelines, so we only focus on users who are truly engaging.

Tadas Kertenis

Co-founder, Hoperfy

Frequently askedquestions.

Everything you need to know about Intempt Insights.

  • An analytics insights tool lets you pick any metric, define any time range, apply any segment filter, and see how that metric has moved over time. Intempt Insights goes further by watching every metric and explaining what changed and why. Because your email sends and your product events live on the same profile here, it can also tell you which message moved the number - the join most teams lose between Klaviyo and Mixpanel.
Intempt Analytics

Pick any metric. Understand it in seconds.

Ask Blu once. The Data Analyst agent keeps the answer current after you close the tab and flags it the moment the number moves. You hold the strategy layer - which metric matters this quarter - and nothing it queues runs until you say so. No consultant, no quarterly review.

Start for free